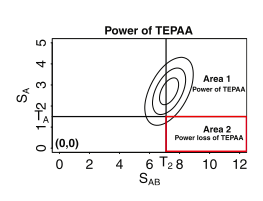
The power loss region of the threshold-based efficient pairwise association approach (TEPAA). The contour lines represent the probability density function of the multivariate normal distribution (MVN). T1(subscript) is the threshold for the first stage. Any SNP with a higher significance than T1 will be passed on to the second stage. T2(subscript) is the threshold for significance of the pairwise test. The area surrounded by the red rectangle corresponds to the power loss region.
Jerry and Jae Hoon demonstrate the utility of TEPAA applied to the Northern Finland Birth Cohort (Rantakallio, 1969; Jarvelin et al., 2004). From their analysis, they observe that the thresholds that control the power loss of the two-stage approach depend on the minor allele frequency (MAF) of the SNPs. In particular, more common SNPs can be filtered out with less significant thresholds than rare SNPs. In order to efficiently implement TEPAA using MAF dependent thresholds for each pair, we group the SNPs into bins based on their MAFs to apply the correct thresholds to each possible pair. After disregarding rare variants with MAF < 0.05, they categorize all common SNPs into nine bins according to their MAF, with step size 0.05. Each pair of SNPs would have two thresholds, one for each SNP in the first stage. We precompute the first-stage thresholds for each combination of two MAFs in order to achieve 1% power loss,while achieving high cost savings. We sort the SNPs within each bin by their association statistics and use binary search to rapidly obtain the set of SNPs above a single threshold to efficiently implement the first stage of our method.
Read our full paper here: