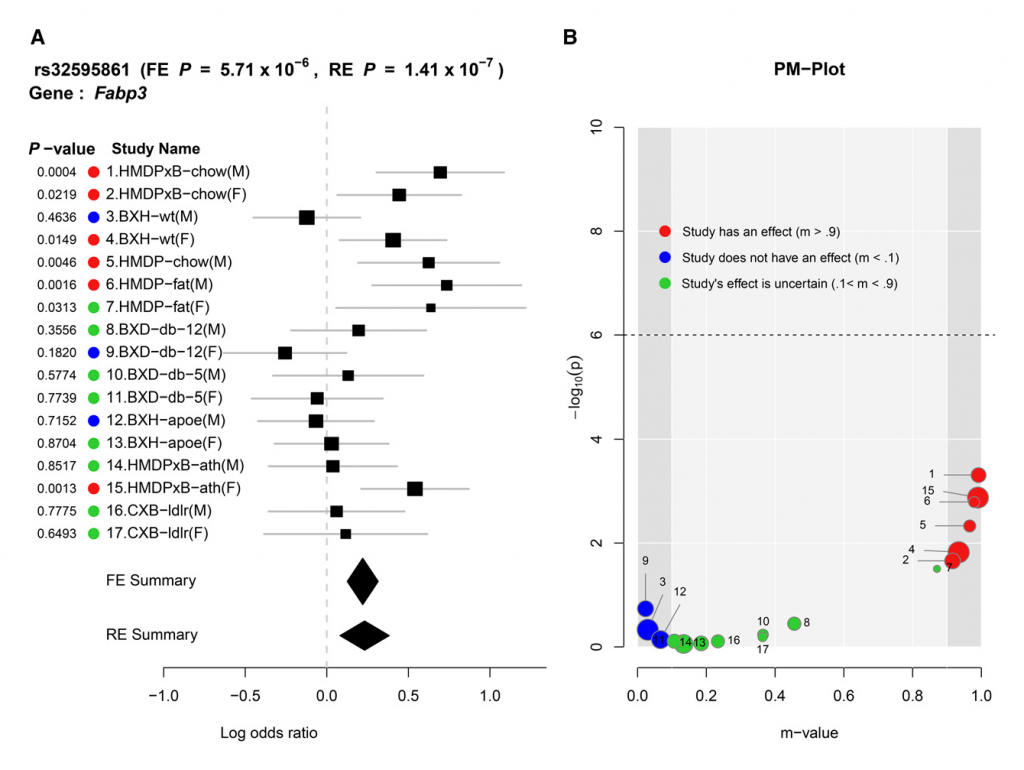
Our group recently published a paper in G3 that presents a new method for interpreting meta-analysis of genomic studies. Our software, called ForestPMPlot, is a free, open-source, python-interfaced R package tool available for download from ZarLab Software. In our article, we demonstrate how ForestPMPlot facilitates interpretation of meta-analysis results by producing a plot that visualizes the heterogeneous genetic effects on the phenotype in different study conditions. We show an example analysis where our visualization framework leads to plausible interpretations of gene-by-environment interaction and multiple tissue eQTL, which would not have been straightforward with the traditional framework.
Meta-analysis has become a popular tool for increasing power in genetic association studies, yet it remains a methodological challenge. Genetic association studies can differ from each other in terms of environmental conditions, study design, population types and sizes, statistical noise, and analytical use of covariates. These factors produce different effect sizes between studies, a phenomenon called between-study heterogeneity. Correctly interpreting and accounting for heterogeneity in genetic association studies would give us a more accurate model of the true effects genetic variants have on traits under specific conditions.
Compared to traditional forest plotting techniques, ForestPMPlot visualizes a broader depth of information useful to interpretation of meta-analysis results. Specifically, our tool helps visualize differences in the effect sizes of genetic association studies and clarify why such studies exhibit heterogeneity for a particular phenotype and locus pair under different conditions. To distinguish studies with an effect from studies without an effect, we use the m-value framework. The m-value (Han and Eskin 2012; Kang et al. 2014) is the posterior probability that the effect exists in each study. In our paper, we explain how to compute an m-value and propose using the PM-plot framework (Han and Eskin 2012) to plot the P-values and m-values of each study together. The PM-Plot visualizes the relationship between m-values and P-values in a two-dimensional space, allowing a researcher to easily distinguish which study is predicted to have an effect, and which study is predicted not to have an effect.
We applied ForestPMPlot to a GWAS meta-analysis of 17 HDL mouse studies that have different environmental conditions, such as diet (e.g., high fat/low fat), and genetic knockouts, including homozygous deficiency in leptin receptor (db/db), LDL receptor knockouts, and Apoe gene knockouts. Here, we observe that two confidence intervals of effect estimates overlap each other when only considering the effect size estimates in forest plot format. This result is ambiguous if the observed heterogeneity is a result of stochastic errors. However, in the PM-Plot, we observe that the posterior probabilities are well segregated for these two studies (m-value: 0.93 vs. 0.03), allowing us to hypothesize that the SNP effects on HDL in these strains under the Western diet condition can be interacting with sex.

Seventeen mouse HDL studies with various environmental/genetic conditions are combined in this meta-analysis. (A) Forest plot and (B) PM-plot for rs32595861 locus (Fabp3 gene) analyzing data from the Kang et al. (2014) study.
We continue to develop new applications for ForestPMPlot, and we hope that our tool will facilitate more accurate interpretations of meta-analysis in future genetic association research.
ForestPMPlot was developed by Eun Yong Kang and Yurang Park. The article is available at: https://www.ncbi.nlm.nih.gov/pmc/articles/PMC4938634/.
Visit the following page to download ForestPMPlot: http://genetics.cs.ucla.edu/meta_jemdoc/
The full citation to our paper is:
This paper describes methods implemented based on research originally published by this group:
We discussed these methods and papers in a 2013 blog post: http://www.zarlab.xyz/heterogeneity-and-meta-analysis/

